


Content
Build real skills in data and AI, learn from experts
Build real skills in data and AI, learn from experts
Our academy offers hands-on training in analytics, AI and data tools — built around how these skills are actually used in business, not just theory.
Our academy offers hands-on training in analytics, AI and data tools — built around how these skills are actually used in business, not just theory.

Individual Learners
Am I using Excel and data tools to their full potential at work? Could I get a better role if I knew Python, SQL, or Power BI? Do I want to move into data analytics but don't know where to start? Am I spending hours on reports that could take minutes?
Individual Learners
Am I using Excel and data tools to their full potential at work? Could I get a better role if I knew Python, SQL, or Power BI? Do I want to move into data analytics but don't know where to start? Am I spending hours on reports that could take minutes?
Working Professionals
Is my team making decisions based on instinct rather than data? Are we buying tools we don't actually know how to use well? Would upskilling my analysts meaningfully improve output quality? Do I want AI readiness for my team but don't know what that means practically?
Working Professionals
Is my team making decisions based on instinct rather than data? Are we buying tools we don't actually know how to use well? Would upskilling my analysts meaningfully improve output quality? Do I want AI readiness for my team but don't know what that means practically?
Students & Career Switchers
Do I need industry-relevant skills that university didn't teach me? Am I applying for data roles but lacking the practical portfolio to back it up? Do I want real project experience, not just certificates? Which tools should I actually learn first to get hired?
Students & Career Switchers
Do I need industry-relevant skills that university didn't teach me? Am I applying for data roles but lacking the practical portfolio to back it up? Do I want real project experience, not just certificates? Which tools should I actually learn first to get hired?
Unlock the skills your career or your team is waiting for
Data Transformation & AI Enablement
A single source of truth. Real-time dashboards. AI-ready execution.
From Excel and Power BI to Python and AI tools, every course at Klaymatrix Academy is designed by active consultants who solve real business problems every day. You learn the same skills, on the same kind of data, that we use with our clients.
Whether you're looking to get hired, get promoted, or get your team performing — this is where that starts.
Do I have the skills that the employers actually want?
Would upskilling my analysts actually move the needle?
Am I applying for roles but have no portfolio to show?
Do I need AI-ready teams but don't know where to start?
Am I spending hours on reports that should take minutes?
Are we paying for tools nobody knows how to use properly?
Could I do my job faster if I actually knew these tools?
I want to break into data but don't know which skills to learn first?
Is my team making decisions on gut feel instead of data?
Am I getting passed over for roles because I lack data skills?
Our Courses
No fluff, no jargons - just the skills the market actually demands.
Learning Formats
Learn the way that works for you or your team.
Self-Paced Online
Learn at your own speed. Lifetime access to course content, video lessons, exercises, and community support. Start anytime.
Self-Paced Online
Learn at your own speed. Lifetime access to course content, video lessons, exercises, and community support. Start anytime.

Live Virtual Cohort
Scheduled live sessions with a Klaymatrix instructor. Real-time Q&A, peer interaction, and accountability. Limited batch sizes.
Live Virtual Cohort
Scheduled live sessions with a Klaymatrix instructor. Real-time Q&A, peer interaction, and accountability. Limited batch sizes.
Corporate Training
We bring training directly to your team. Custom curriculum, your datasets, your tools, your schedule. For 5 to 500 people.
Corporate Training
We bring training directly to your team. Custom curriculum, your datasets, your tools, your schedule. For 5 to 500 people.
Hybrid Learning
Combine self-paced modules with scheduled live sessions. The most flexible option for busy professionals.
Hybrid Learning
Combine self-paced modules with scheduled live sessions. The most flexible option for busy professionals.
Custom Training
Work with our experts to desing learning plans for your teams as per your requirements.
Custom Training
Work with our experts to desing learning plans for your teams as per your requirements.
Testimonials
When complexity turns into clarity, results speak for themselves. Here’s what our clients experienced.

Kimberly Patrick
CONSULTANT, UN Wash, ITALY
"...We worked together on some very challenging assignments. ..."

"We worked together on some very challenging assignments. Technically very strong, continuous commitment to clear communication underpins the quality and accuracy of their work. I look forward to continued collaborations."
Kimberly Patrick
CONSULTANT, UN Wash, ITALY

Aditya Kelshikar
Global Head, financial data resources debtwirE, iNDIA
"...Manvirender from Klaymatrix Data Labs, trained a couple of batches of our employees on Power BI. ..."

"Manvirender from Klaymatrix Data Labs, trained a couple of batches of our employees on Power BI. He is a fantastic trainer. His coaching method not only ensures you thoroughly understand the concepts, but also sparks a greate interest to further explore the world of data analytics and Visualization."
Aditya Kelshikar
Global Head, financial data resources debtwirE, iNDIA


Anjali Naik Piramal
Global head of data analytics Mergermarket, iNDIA
"...Delivered very extensive session on data science, Analytics - using live examples..."

"Delivered very extensive session on data science, Analytics - using live examples, case studies and a very hands on approach. Since then I have done multiple projects with them and always find their team to be thorough, professional and timely ! (views are my own)"
Anjali Naik Piramal
Global head of data analytics Mergermarket, iNDIA

Altan Aplay
VC Partner and CIO, Sarus select capital, UK
"...They did a complex Project Workflow & code conversion for me...."

"They did a complex Project Workflow & code conversion for me. At each stage of the process, they thoroughly inquired and thierinsights helped me change the design to a more flexible and faster solution. Highly recommended."
Altan Aplay
VC Partner and CIO, Sarus select capital, UK

Kimberly Patrick
CONSULTANT, UN Wash, ITALY
"...We worked together on some very challenging assignments. ..."
"We worked together on some very challenging assignments. Technically very strong, continuous commitment to clear communication underpins the quality and accuracy of their work. I look forward to continued collaborations."
Kimberly Patrick
CONSULTANT, UN Wash, ITALY
Aditya Kelshikar
Global Head, financial data resources debtwirE, iNDIA
"...Manvirender from Klaymatrix Data Labs, trained a couple of batches of our employees on Power BI. ..."
"Manvirender from Klaymatrix Data Labs, trained a couple of batches of our employees on Power BI. He is a fantastic trainer. His coaching method not only ensures you thoroughly understand the concepts, but also sparks a greate interest to further explore the world of data analytics and Visualization."
Aditya Kelshikar
Global Head, financial data resources debtwirE, iNDIA
Anjali Naik Piramal
Global head of data analytics Mergermarket, iNDIA
"...Delivered very extensive session on data science, Analytics - using live examples..."
"Delivered very extensive session on data science, Analytics - using live examples, case studies and a very hands on approach. Since then I have done multiple projects with them and always find their team to be thorough, professional and timely ! (views are my own)"
Anjali Naik Piramal
Global head of data analytics Mergermarket, iNDIA
Altan Aplay
VC Partner and CIO, Sarus select capital, UK
"...They did a complex Project Workflow & code conversion for me...."
"They did a complex Project Workflow & code conversion for me. At each stage of the process, they thoroughly inquired and thierinsights helped me change the design to a more flexible and faster solution. Highly recommended."
Altan Aplay
VC Partner and CIO, Sarus select capital, UK
ABOUT THE ACADEMY
We’re Klaymatrix Data labs, where you learn from experts
Trusted:
15K+ students | 5+ countries | 50+ clients
We teach what we practise
Every solution is shaped around your operations, data maturity, and goals: no jargon, no one-size-fits-all playbooks.
We train for the real world
Our students work with messy, real-world datasets - not clean tutorial data. That's what prepares you for an actual job.
We care about your outcome
We track what happens after you finish. Career transitions, promotions, team improvements - those are our real metrics.
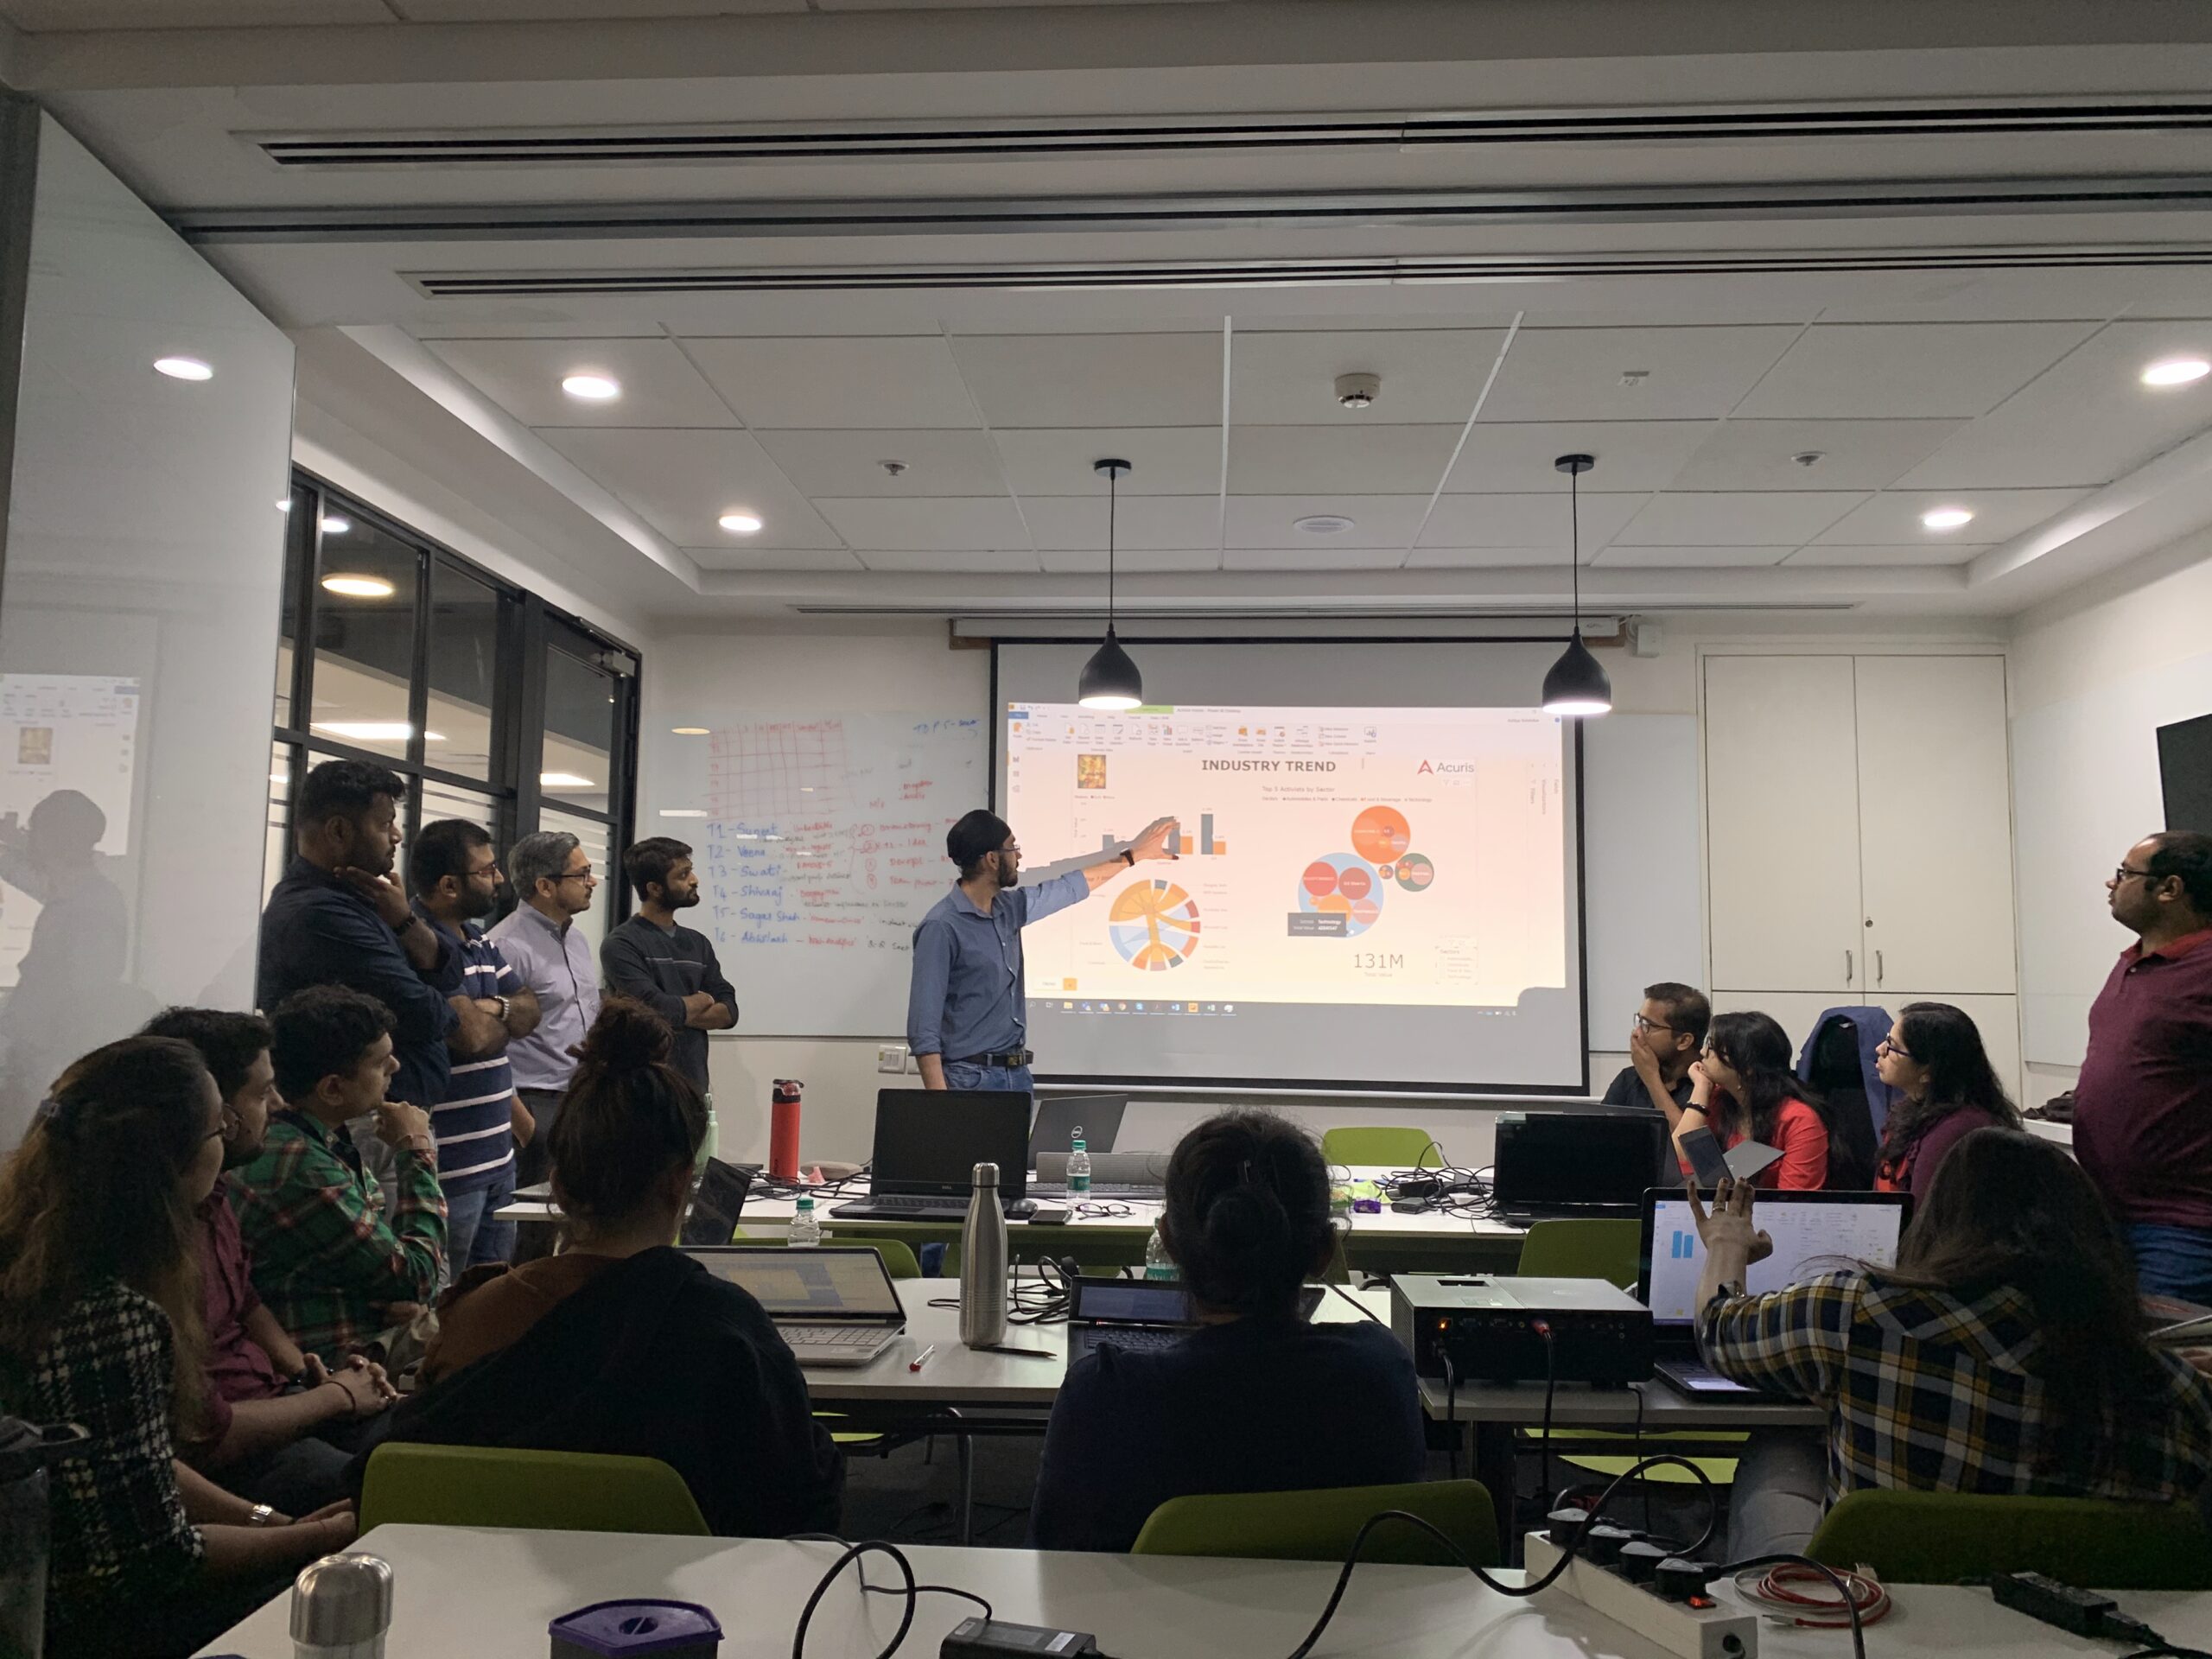
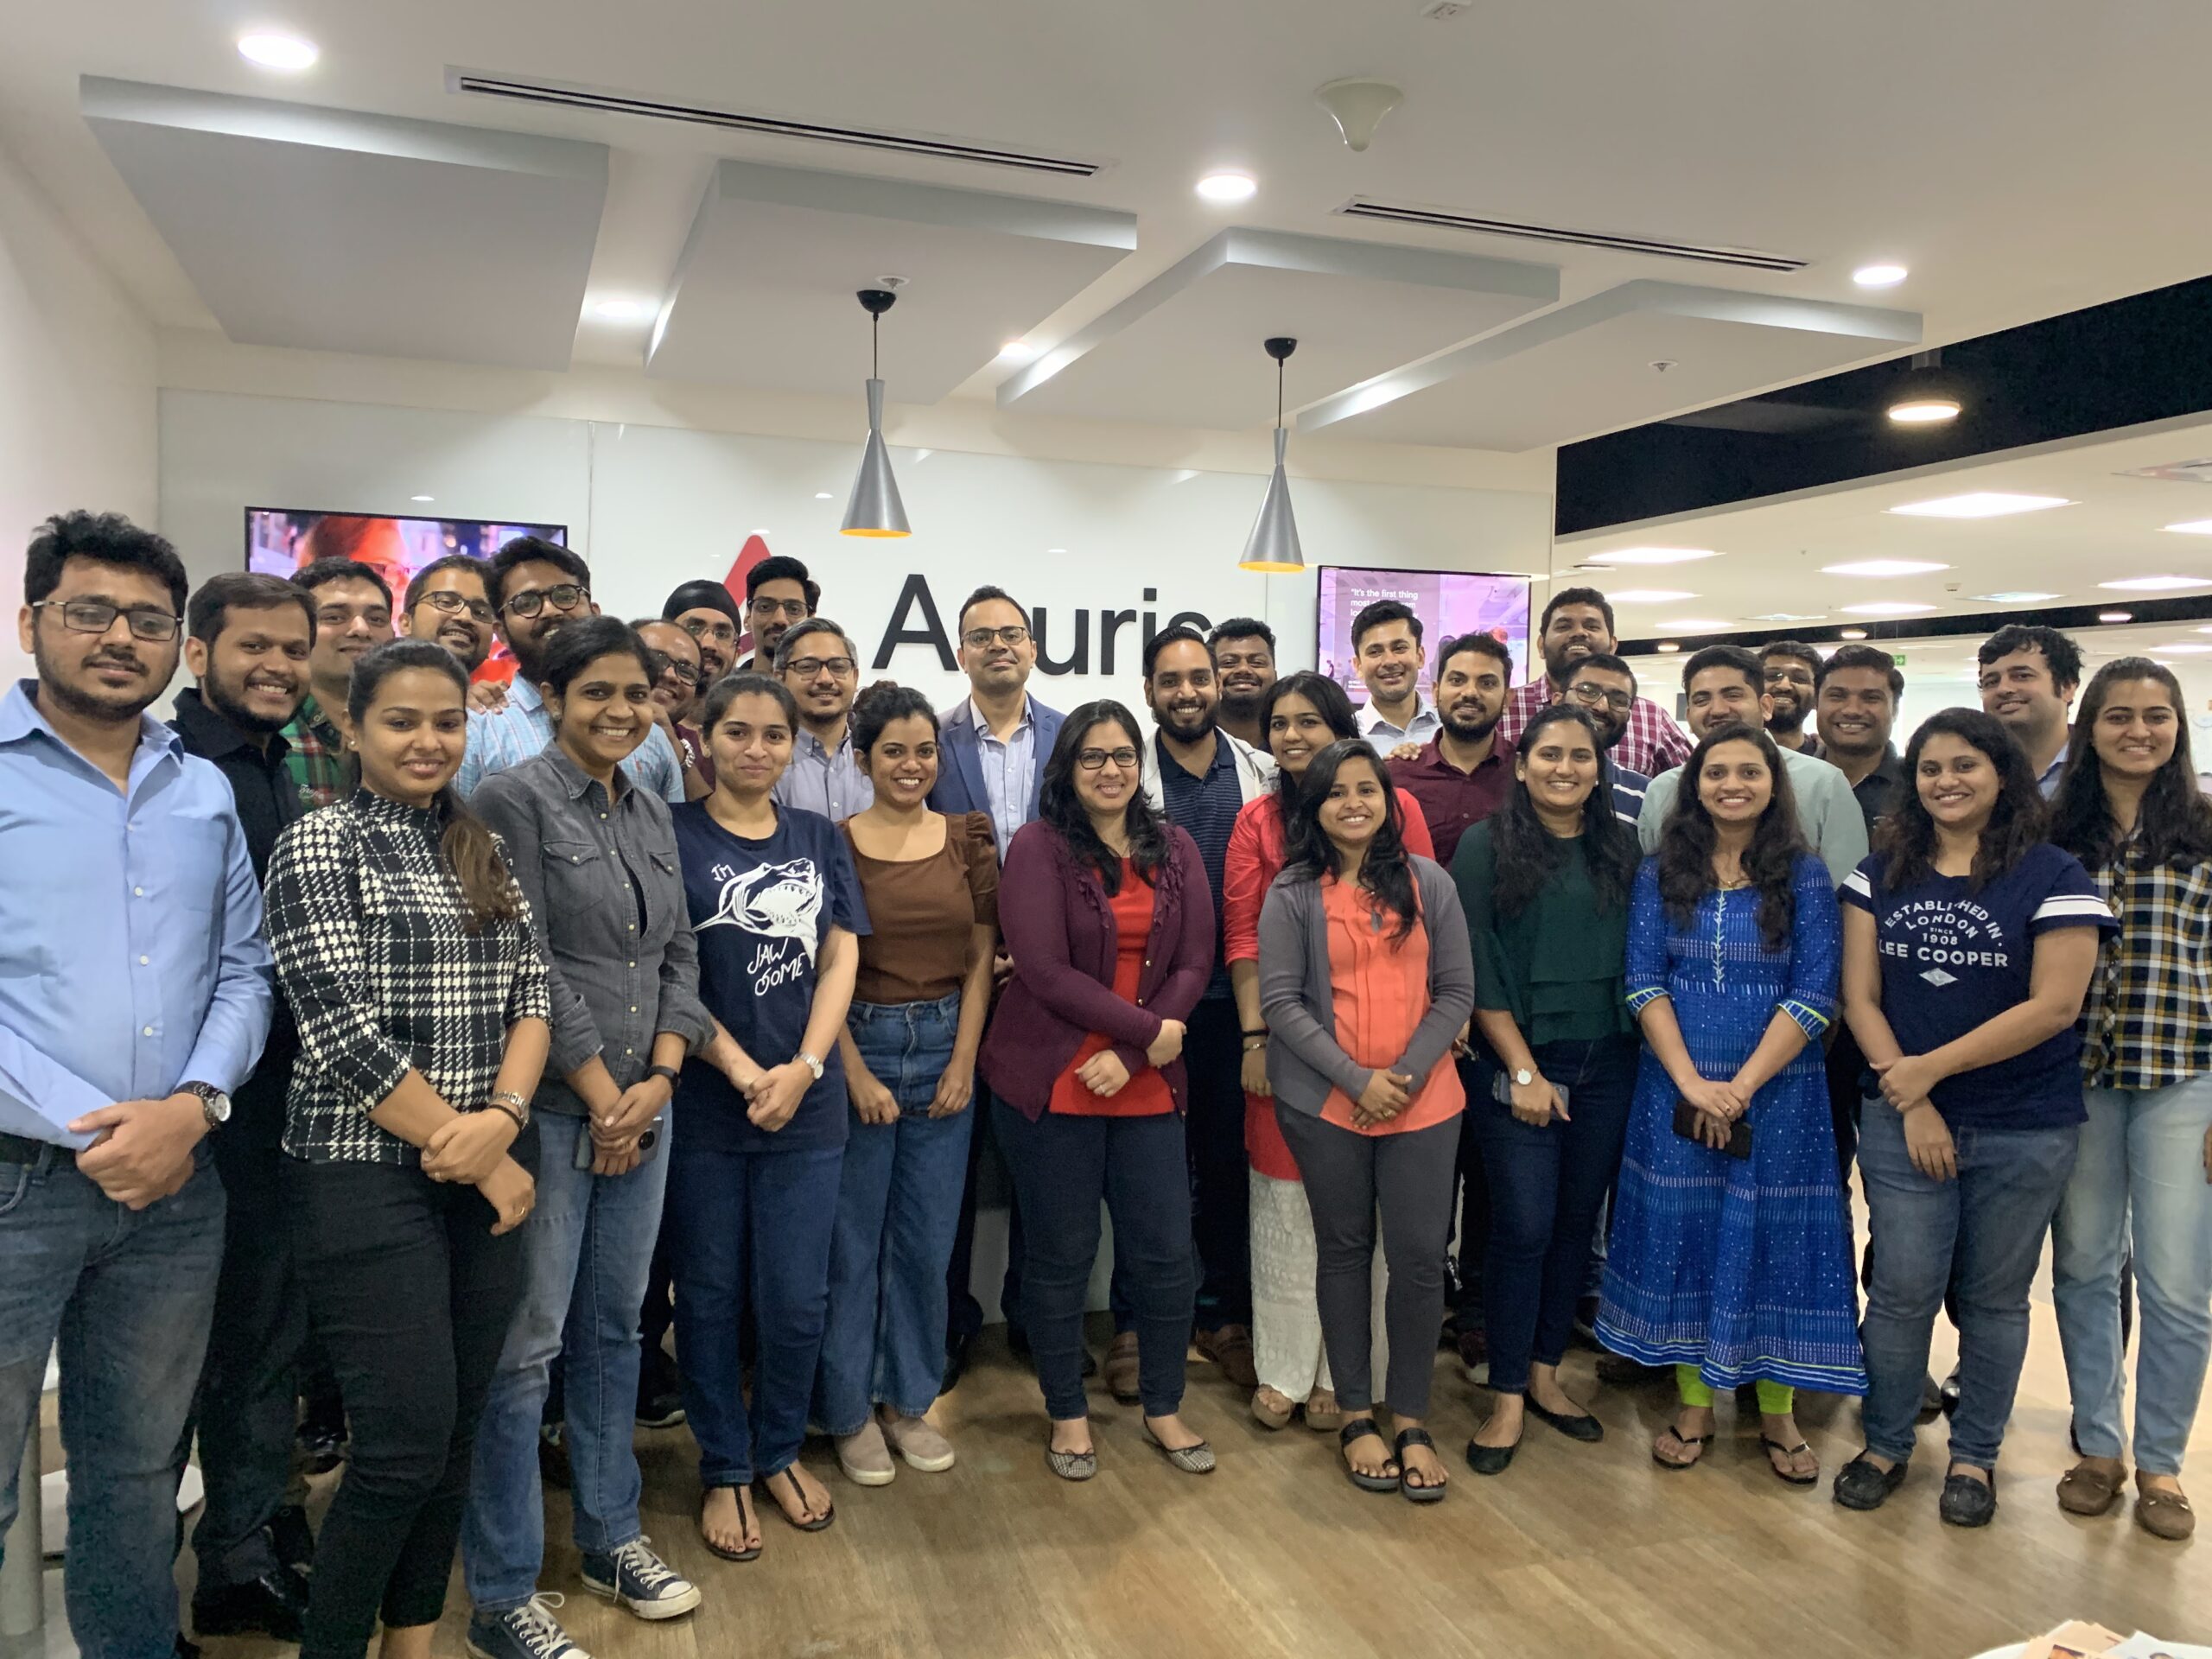
Past Training


How it works
From curious to capable in four steps.
Step
1
Choose your course
Browse the catalog, read what's covered, and pick the course that matches where you are and where you want to go.
Step
3
Learn by doing
Work through video lessons, hands-on exercises, and real datasets. No passive watching — every module has something to build or solve.
Step
2
Enrol and get access
Complete enrolment in minutes. You'll get immediate access to your learning dashboard, course materials, and community.
Step
4
Earn your certificate
Complete assessments, finish the course, and receive your Klaymatrix certificate — shareable on LinkedIn and backed by 15 years of industry credibility.
learning stats
Numbers that back our training capabilities.
Training Numbers
K
Professionals Trained
5+ industries served
3+ countries reached
Training Numbers
K
Professionals Trained
5+ industries served
3+ countries reached
Training Numbers
K
Professionals Trained
5+ industries served
3+ countries reached
Avg. Trainer Experience
+
Years of experience
99% client satisfaction rate
High proportion of repeat clients
Avg. Trainer Experience
+
Years of experience
99% client satisfaction rate
High proportion of repeat clients
Avg. Trainer Experience
+
Years of experience
99% client satisfaction rate
High proportion of repeat clients
Impact
+
Corporate Trainings
100% datascience job readiness
On-premise and online
Impact
+
Corporate Trainings
100% datascience job readiness
On-premise and online
Impact
+
Corporate Trainings
100% datascience job readiness
On-premise and online
The difference we make
Why learning here, hit different
There are two paths to becoming data-and-AI ready. One is structured, measurable, and built for real impact. The other costs more time, effort, and certainty
There are two paths to becoming data-and-AI ready. One is structured, measurable, and built for real impact. The other costs more time, effort, and certainty
Generic Online Courses
Klaymatrix Academy
taught by
Content Creators
Active Consultants
taught by
Content Creators
Active Consultants
Datasets
Tutorial toy data
Real business datasets
Datasets
Tutorial toy data
Real business datasets
Curriculum Basis
What's popular
What employers need
Curriculum Basis
What's popular
What employers need
Outcome focus
Course completion
Skill application
Outcome focus
Course completion
Skill application
Support
Forum threads
Instructor driven
Support
Forum threads
Instructor driven
Frequently Asked Questions
We get asked this all the time
This is a LIVE online course with quizzes, datasets, hands-on exercises and we are re-inventing everyday. You can use our easy to follow portal and practice using instructions and datasets given.
Answer
What all do the online courses offer ?
Question
On successful completion of the course your certificate would be available under your profile dashboard. The certificate has unique ID and can be verified online through our website.
Answer
Do I get a certification ?
Question
All software are freely available. Our course will explain in detail ‘where from’ and ‘how to’ install the software.
Answer
Do I need to buy any software ?
Question
Our courses have some lessons in free preview mode. You can also request some samples by sending a request to support@klaymatrix.com
Answer
What if I want to preview the course first ?
Question
This course has been designed by an experienced team of trainers and developers with experience ranging between 15 to 20 years. Some of our in house trainers are visiting faculty at many renowned academic institutions and have conducted training for various corporates and academic institutions.
Answer
Who are the course instructors and creators ?
Question
Register on our website or reach out to us at: support@klaymatrix.com Our team will do the needful.
Answer
How do I enroll for a course ?
Question
There is a well structured process which would be explained in detail at kick-off. At high level, the stages are engagement phase, first cut, final cut and final delivery.
Answer
What are various phases of delivery ?
Question
Blogs and Insights
Ideas, frameworks, and insights for the data-and-AI-driven future

Reach out, and we’ll take it from there — with a clear path, structured guidance, and measurable next steps
Phone
+91 9971796261
support@klaymatrix.com
Opening Hours
Mon to Sat: 9.00am - 7.30pm
Sat & Sun: Closed
9:52:22 AM
Services

KLAYMATRIX.
Reach out, and we’ll take it from there — with a clear path, structured guidance, and measurable next steps
Phone
+91 9971796261
support@klaymatrix.com
Opening Hours
Mon to Sat: 9.00am - 7.30pm
Sat & Sun: Closed
9:52:22 AM
Services
Reach out, and we’ll take it from there — with a clear path, structured guidance, and measurable next steps
Phone
+91 9971796261
support@klaymatrix.com
Opening Hours
Mon to Sat: 9.00am - 7.30pm
Sat & Sun: Closed
9:52:22 AM
Services