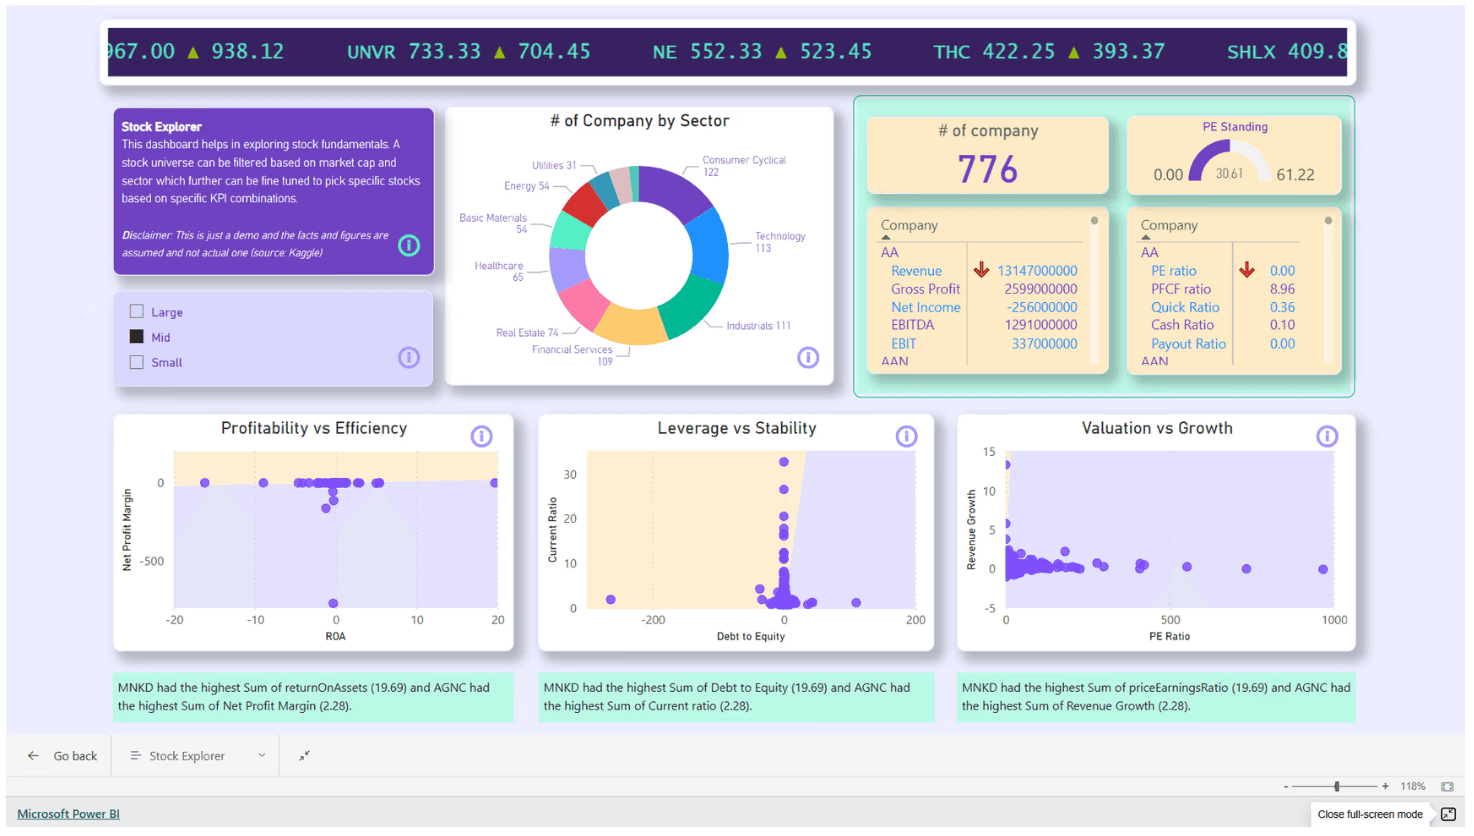
Our Engine A financial intelligence platform that makes complex fundamental analysis intuitive. Quadrant mapping instantly positions companies on Profitability-Efficiency and Valuation-Growth matrices. Key metrics like Net Profit Margin, ROA, PE ratios, and Debt-to-Equity ratios become comparable at a glance, not after hours of spreadsheet work.
The Innovation: Dynamic sector filtering with real-time metric recalculation, paired with intelligent bucketing algorithms that identify outliers and opportunities across 700+ securities in milliseconds. This isn't data visualization—it's investment intelligence.
About author
Manvirender is a data enthusiast and founder at Klaymatrix Data Labs

Manvirender Singh Rawat
Head of Strategy
Get AI & data insights — straight to your inbox
Sign up to get the most recent blog articles in your email every week.